Introduction
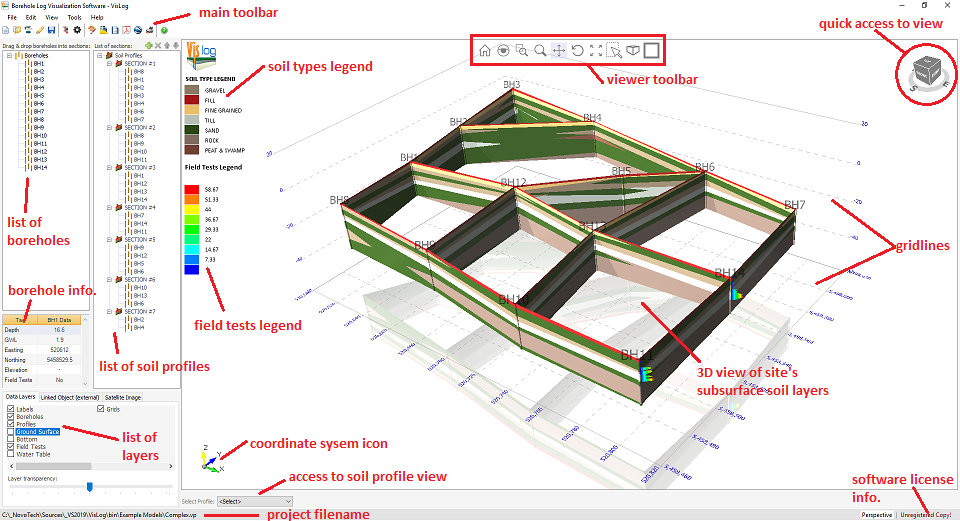
The user interface of VisLog is designed to be intuitive and easy to use. The main elements of the program's screen are shown in the following illustration. In general, the left portion of the page includes boreholes, soil profiles and layers. The right portion of the page comprises the 3D view of the subsurface soil layers.
A typical data entry flow starts with entering borehole data, and follows by defining soil profiles. You can toggle on/off various data layers and interact with the 3D viewer. When the model is made, you can export it to various formats. |