Borehole Editor
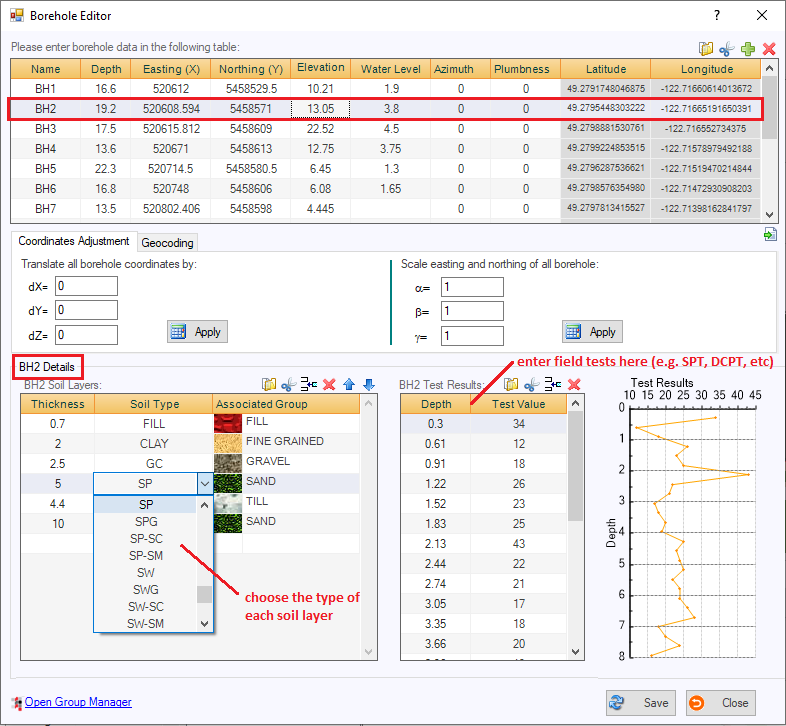
This page is used to add, edit or delete boreholes. You start by adding boreholes, one in a row, in the table at the top of the page. Please note that borehole data requires coordinates (local or UTM datum) but the program uses neutral units system: All input data in VisLog are unit-neutral; However, depth and coordinates of a borehole must be in the same units system. Remember that VisLog only deals with presentation of your data and no interpretation or data-manipulation is performed. Manual Data EntryTo enter a new borehole click on "Add new borehole" button on toolbar; a new empty row will be added to the end of the boreholes and soil layers table. Please enter borehole data in the new row and then enter soil layers of the borehole and test data on corresponding tables. Import From Text FileIf you have already stored the boreholes data in a Text file, you can easily import them (using the yellow folder icon on top-right corner of tables) into VisLog . Please read The Import from File help page for more information. If your data is entered in an Excel file, save it to Text format and then import it to VisLog.
Coordinate AdjustmentUse the tab located below the borehole table to manipulate coordinates. GeocodingThis feature requires UTM coordinates of boreholes. Read more about geocoding in this article.
|