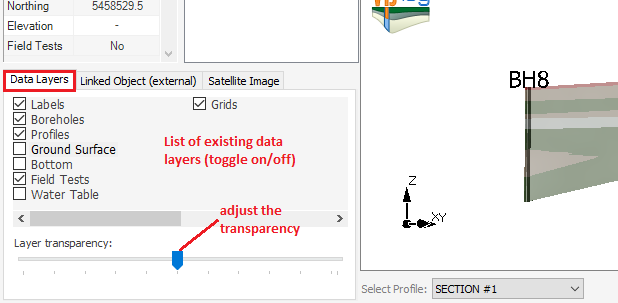
In VisLog , all available data layers could be turned on/off by using the checkbox before each item on "Data Layers" tab at the bottom-left portion of the screen. Also when a layer is selected, its transparency may be adjusted by the slide-bar below the list:
Labels
|
Borehole labels.
|
Boreholes
|
Represents all boreholes of this model.
|
Profiles
|
Represents all soil profiles defined by the user.
|
Ground Surface
|
Represents a triangulated 3D surface of the ground surface. This surface is triangulated based on top elevation of boreholes.
|
Bottom Surface
|
Represents a triangulated 3D surface of the bottom of boreholes. This feature may be especially useful when boreholes were terminated due to encountering bedrock; In this case, this surface shows the bedrock surface.
|
Field Tests
|
Represents the plots of field test data for each borehole. This field test data could be SPT, Vane Shear, CPT, DCPT and any other field test. This plots are dimensionless, so literally any test results can be presented using this feature.
|
Water Table
|
Represents a triangulated 3D surface of the water level based on boreholes data.
|
Grids
|
Gridlines show the bounding box of this 3D model.
|
Adjusting Transparency
To change the transparency level of each info-layer, simply click on it and then use the slide-bar to adjust the transparency of the object. While dragging, notice the change in transparency of the info-layer in the viewer.
|