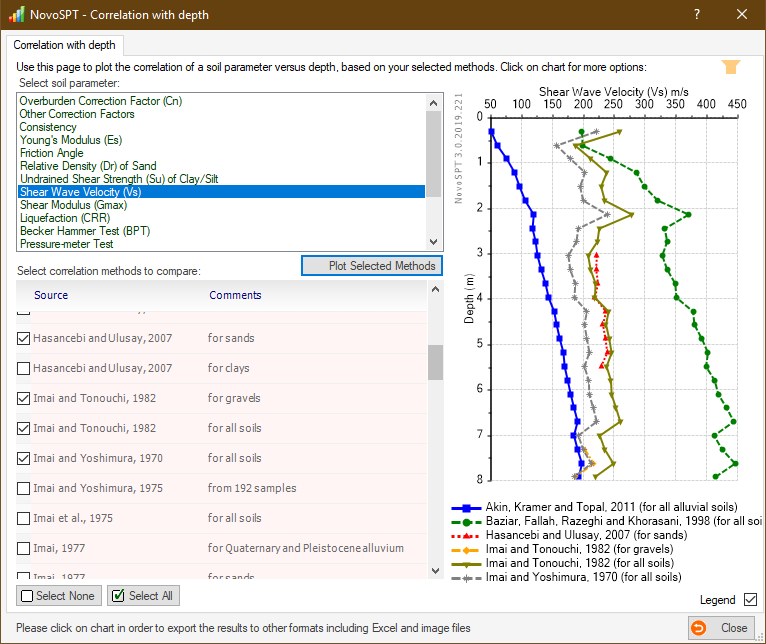
Correlation with depth
This feature is designed to plot the variation of a soil parameter in depth of a borehole based on SPT blow counts, and is accessible from View→Correlation versus depth of the borehole menu. Follow these steps to obtain the correlation in depth of borehole:
For example, in the above screenshot, 6 methods are selected and plotted along the depth of the borehole.
Note : Please notice that in this example, the funnel icon on top-right corner of the page indicates the soil type filter is ON. This means that only those correlations which are derived for the same soil type will be listed at each depth. Soil type at a depth is obtained from soil layers input data. |
