Top Toolbar
Th toolbar at the top of the main page provides quick access to various actions such as open, save, importing CPT data, and conducting engineering analyses. The following provides more details about different tabs of the top toolbar.
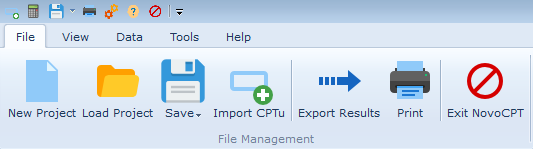
File Tab
This tab allows you to start a new project, load an existing NovoCPT project, save the NovoCPT project or import from a CPT file. You can also export the results (graphs and tables) or print the analyses results.
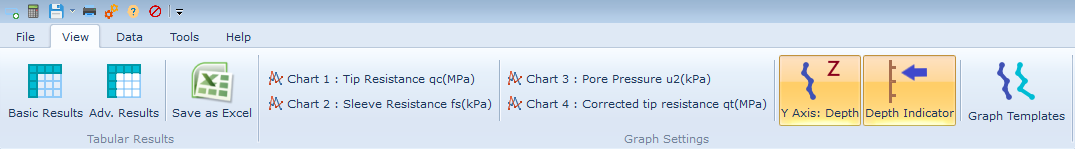
View Tab
This tab allows you to interact with the analyses results, i.e. graphs and tables.
Basic Results: View the results of basic CPT processing.
Adv. Results: View the results of advanced CPT processing.
Chart 1 to Chart 4: You can choose which soil parameters be shown on the main four charts shown on screen. Just click on each toolbar item and choose the desired soil parameters.
Y Axis: You can choose to show the 'depth' or 'elevation' on the vertical axis of the charts. Please note you can set the collar elevation for the CPT borehole on this page.
Depth Indicator: If selected, this will show a depth indicator (an arrow) when you select rows in the Basic and Advanced Results tabs. This way as you go over the tabular test results, the corresponding depth will be shown on all graphs.
Graph Templates: This allows you to change the default graph settings on the Options page (see more).
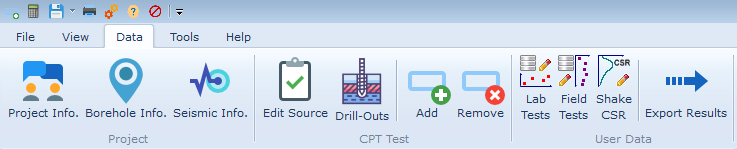
Data Tab
This tab allows to edit project / borehole information. In addition you can:
Edit Source: You can edit the original CPT data (qc, fs, u2) for each CPT test.
Drill-Outs: You can view the list of all drill-outs automatically recognized for this CPT test. See this article for more details.
Add: You can add a new CPT test to this project. This will open the Import CPT File dialog page.
Remove: This will remove the selected CPT file from this NovoCPT project.
Lab Tests: You can add laboratory test results (sieve tests, Atterberg limits) on this page. This data will be displayed on relevant CPT graphs for comparison / interpretation purposes.
Field Tests: You can add field test results (shear wave velocity, vane shear, standpipe piezometer readings) on this page. This data will be displayed on relevant CPT graphs for comparison / interpretation purposes.
Shake CSR: If you use SHAKE software for preparation of site-specific dynamic response spectrum, you can use this feature to enter CSR calculated by SHAKE into NovoCPT. This will be used for soil liquefaction analysis by NovoCPT.