Report Manager
This page can be used to choose the graphs you want to print. The following options are available:
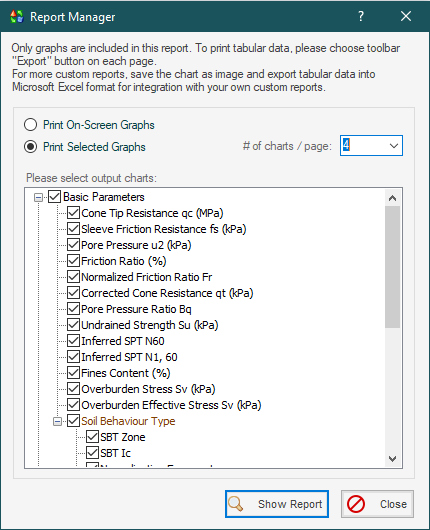
Print On-screen Graphs: Choose this option if you want to only print the graphs already shown on the screen. Print Selected Graphs: If you prefer to choose more graphs than those plotted on the screen, choose this option and select the subject charts from the list. There is no limitation for the number of charts in each report. # of Charts / Page: Defines the number of page which should be inserted on each page of the report.
|