Correlated results
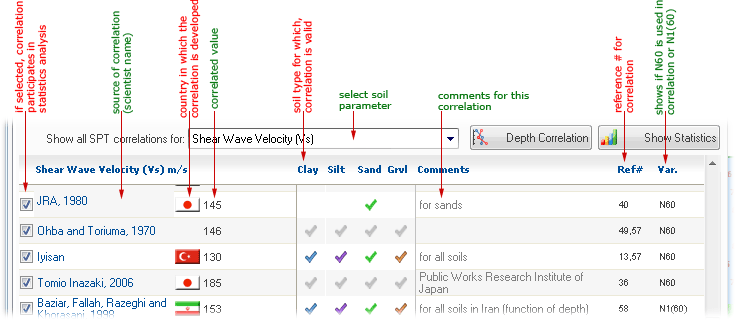
When data entry in NovoSPT is completed, pressing ![]() Start Analysis button will show the correlated results. NovoSPT uses more than 300 correlation correlations to prepare these results. For each soil parameter (e.g. "Relative Density Dr"), all available correlations are summarized in a table describing the reference, parameter value, and comments regarding each correlation used. The following screenshot describes parts of the correlation table:
Start Analysis button will show the correlated results. NovoSPT uses more than 300 correlation correlations to prepare these results. For each soil parameter (e.g. "Relative Density Dr"), all available correlations are summarized in a table describing the reference, parameter value, and comments regarding each correlation used. The following screenshot describes parts of the correlation table:

Each method may be turn on/off by using the checkbox in the first column and will be added/removed from the statistics chart.
To view the statistics of all correlation for selected soil parameter, click on ![]() Show Statistics button (read more). If correlation of selected soil parameter in depth of borehole is required, click on
Show Statistics button (read more). If correlation of selected soil parameter in depth of borehole is required, click on ![]() Depth Correlation button (read more).
Depth Correlation button (read more).
How to Copy Table Contents
If necessary, you can simply copy data within each table by selecting the target rows (by holding left mouse button down and selecting the rows), and then pressing CTRL+C. Thereafter, pressing CTRL+V in any other editor in Windows, pastes the data.
How to Export the Results Table to Microsoft Excel
Click on the table, and then select ![]() Tables⏵Save As MS Excel ... menu. Choose the file name and path in the dialog and the table will be saved as an Excel file.
Tables⏵Save As MS Excel ... menu. Choose the file name and path in the dialog and the table will be saved as an Excel file.
Visualization of Correlated Values
To better visualize the results of a specific soil property, a graph is presented on statistical chart. This graph shows scatter of the results for each soil parameter and helps user to compare those values and pick the most reasonable range for that parameter. Please notice that for those formulas which provide a range for the parameter, the corresponding value in graph is shown as a vertical bar representing the minimum and maximum recommended range. To view additional information, move the mouse over each point on the graph to get more information about the method.