Sieve Test
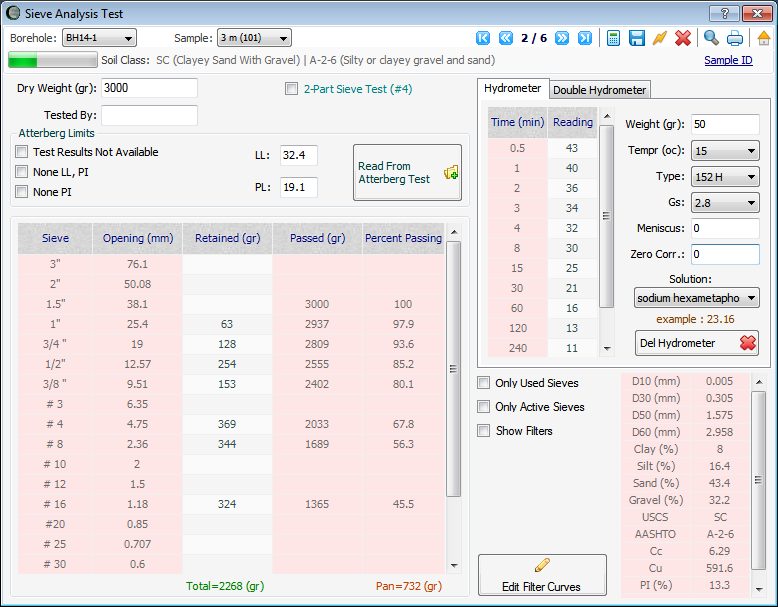
This page is used for data entry of sieve analysis test and to view / print the test results. This page can be accessed from the Soil Mechanics Lab. menu. The main input data consists of sample weight, Atterberg limits and hydrometer data.
Weights: In most cases one sample is used for sieve analysis. However, if the sample is divided to two parts (i.e. retained above the sieve #4 (4.75 mm opening) and below sieve #4) select the "2-Part Sieve Test (#4)" checkbox and enter the weight of the second sample as well. In addition, please enter the weight of the retained soil on each sieve in the table. Please note that data should be entered in the white cells. The red cells are automatically calculated by the program.

Atterberg Limits: If Atterberg limits test is done on this sample you can click on "Read From Atterberg Test" button, and LL and PL will be automatically retrieved from database and will be placed in the corresponding fields. If Atterberg limits data for this sample has not been entered in NovoLAB, simply enter LL and PL values or select from the appropriate checkboxes on the left.
Hydrometer: If hydrometer test (below sieve #200) is conducted, enter data in the corresponding tables. Please note depending on type of hydrometer used (151H or 152H) data with different formats should be entered (follow the example shown on screen when selecting the hydrometer type).
- Only Used Sieves: select this checkbox to see only those sieves with non-zero retained weights. This allows you to quickly check your input data with the laboratory sheets for any data entry error.
- Only Active Sieves: select this checkbox to only show the sieves mostly used in your laboratory (hence, a faster data entry). See this article for more information.
- Show Filters: if this checkbox is selected, filter curves are shown on the sieve analysis report. To edit the filter curves data click on "Edit Filter Curves" button.
Test Results
After data entry, click on calculate button from the tests toolbar. Test results will be shown in the table on the bottom-right corner of the screen. You can print the unconfined compression test report by using the tests toolbar.