Preferences
This page can be reached from "Tools & Options" tab on the main toolbar and is designed to set the general preferences such as your company information, fonts, etc. and is described below:
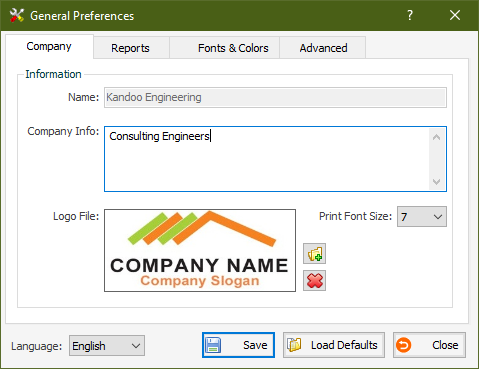
Company tab
This tab is used to enter your company information including a brief text and company logo. You can also specify the size of your company name printed on the reports. Please note that company name is fixed in the license file you received during activation of NovoLAB. If you want to change company name, contact us.
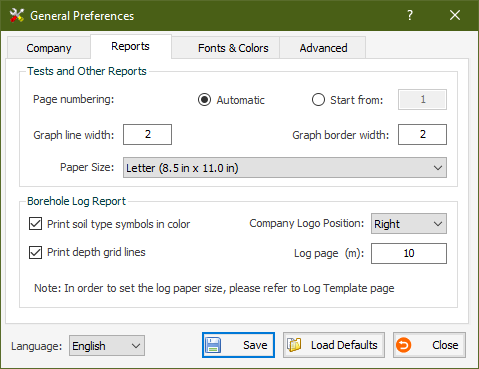
Reports tab
This tab is used for report settings as described below:
- Page numbering: if 'Automatic' is selected, page number in a report starts from 1. If you want to start page numbers from a different number, select 'Start From' option.
- Graph curve width: is used to set the line width of the plots shown on the reports. Choose between a range of 1 to 4.
- Paper size: choose between A4 (210 mm x 297 mm) or Letter size (8.5" x 11").
- Soil type symbols in color: if selected, soil type shading column in boring log will be shown in color, otherwise it will be black and white.
- Print depth grid lines: if selected, a horizontal grid line will be printed on the log for each 2 m of depth.
- Log page interval: this specifies the page length of boring logs.
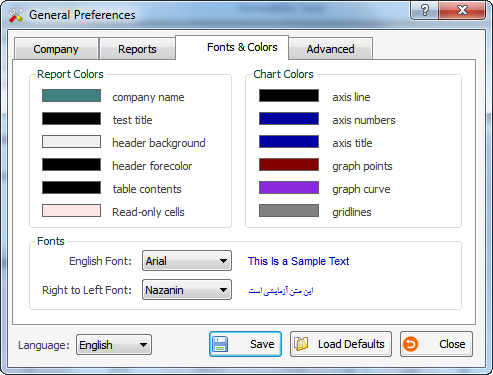
Fonts and Colors tab
This tab is mainly used to select fonts and colors used in the reports and on data entry pages.
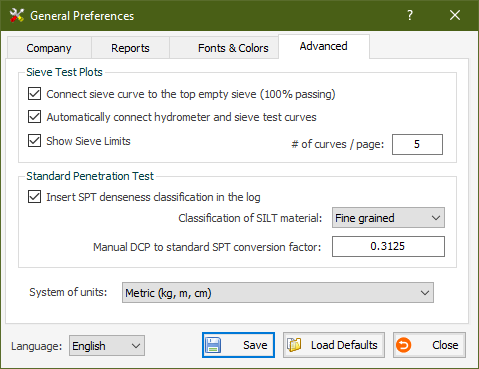
Advanced tab
This tab is used for sieve analysis and SPT settings as described below:
- Connect sieve curve: if selected, the first empty sieve above the first used sieve (with a non-zero retained weight) will be assigned to 100% passing when plotting the sieve curve
- Automatically connecting hydrometer and sieve: these two curves usually do not match on the sieve analysis graph at the particle size of 0.075 mm (#200). If this option is selected, NovoLAB automatically adjusts the hydrometer to percent passing at sieve #200.
- Show filter zones: you can define upper bound and lower bound for filter. This will be printed on sieve analysis report for comparison of material particle size distribution to the sieve requirements (read more).
- # of curves / page: up to 5 sieve tests can be plotted on the same plot. NovoLAB will automatically group the tests based on the desired number.