Robertson 1986
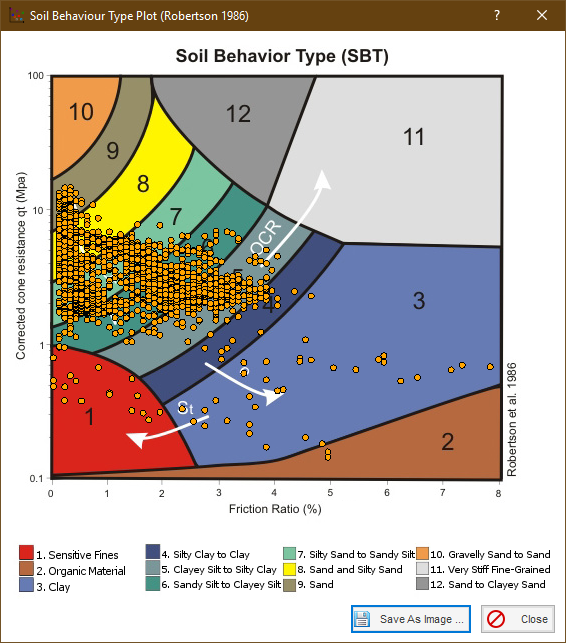
NovoCPT performs CPT interpretation based on "Robertson 1986", "Robertson 1990" and "Jefferies and Been 2006" methods. To see the Robertson 1986 soil behavior type distribution chart, click on Tools→Robertson 1986 button from the top toolbar. This will show the following page:
- Each dot on the graph represents one row of data (at a specific depth). - To save the graph as an image (for further use in your reports), click on Save As Image button at the right-bottom corner of the page. |