Jefferies & Been 2006
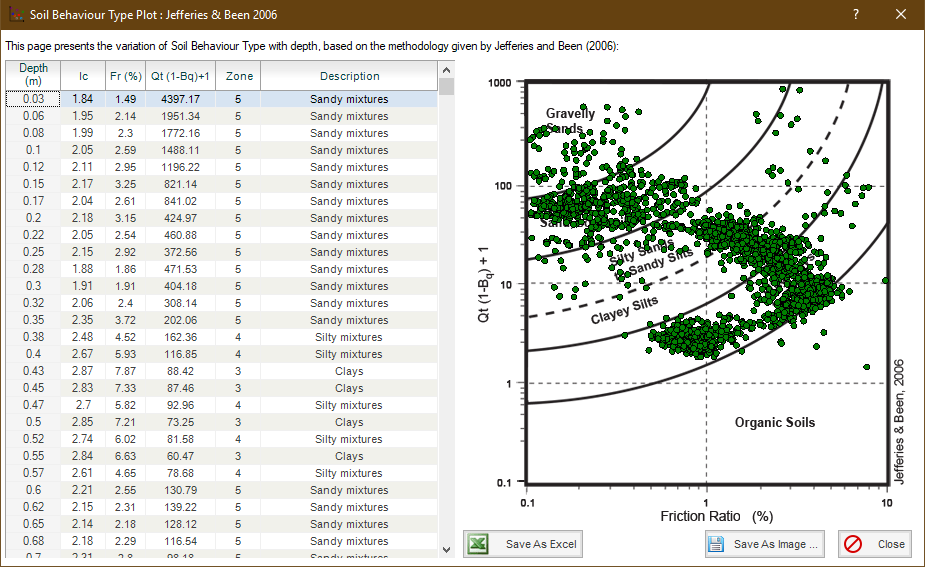
NovoCPT performs the CPT data interpretation based on "Robertson 1986", "Robertson 1990" and "Jefferies and Been 2006" methods. To see the "Jefferies & Been 2006" soil behavior type chart, click on Tools→Jefferies & Been 2006 button from the top toolbar. This will show the following page:
- Each dot on the graph represents one row of data (at a specific depth). - To save the graph as an image (for further use in your reports), click on Save As Image button at the right-bottom corner of the page. - To save the graph as Excel file (for further analysis), click on Save As Excel button at the middle-bottom of the page. |