SPT-Based CRR
All CRR7.5 calculation methods utilized in NovoLiq are described below:
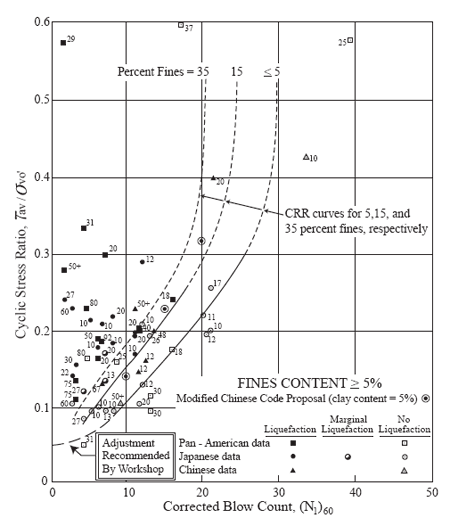
NCEER (1997) and Vancouver Task Force Report (2007)These two methods are very similar expect that in "Vancouver Task Force Report (2007)" a Kσ parameter is multiplied in CRR7.5. In these methodologies, CRR7.5 is a function of depth corrected SPT blow counts N1(60) for clean sand (fines content less than 5 percent). For sands containing more fines content, more corrections will be applied on N1(60). The CRR7.5 curve proposed by these methodologies based on N1(60) is shown below:
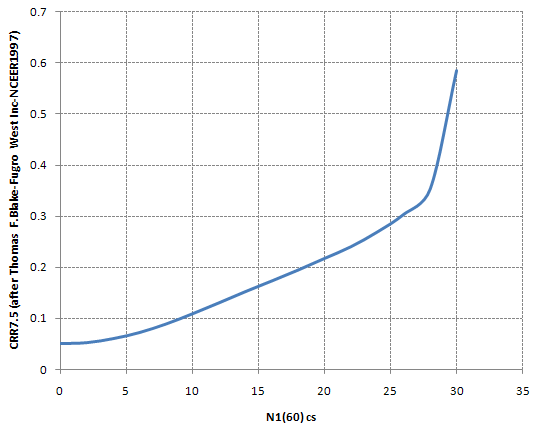
In NovoLiq, the equation proposed by Thomas F. Blake (Fugro West Inc., Ventura, California) recommended by NCEER Workshop (1997) for clean sand curve, as shown below is used. This equation is valid for N1(60)cs≤30
Proposed CRR7.5 curve for clean sand (after Thomas F. Blake - NCEER Workshop)
The Kσ factor is calculated from the following formula: Kσ = (σ΄vo / Pa)f-1
Where Pa is atmospheric pressure in the chosen units and f depends on relative density (Dr) and given by: f = 1 - 0.005 * Dr for 40% < Dr < 80% Dr ≤ 80% can be estimated using Dr = 100 * S(N1(60)/46)
Boulanger and Idriss (2004)The following equation is proposed by Boulanger and Idriss (2004) for clean sand:
Japanese Bridge CodeThis methodology is based on SPT blow counts and particle size distribution of sand.
Where: D50 : particle size corresponding to 50 percent passing Fc : percent fines content passing sieve #200 (clay and silt)
Cetin et al, 2004A complete explanation of this method is presented in the following paper:
Note: Recently there has been technical discussions (by Dr Boulanger and Dr Idriss, 2010) about the accuracy and reliability of Cetin et al (2004) method. Therefore it is recommended that this method is used with caution and full understanding of its risks. For further details please see Appendix A of this document.
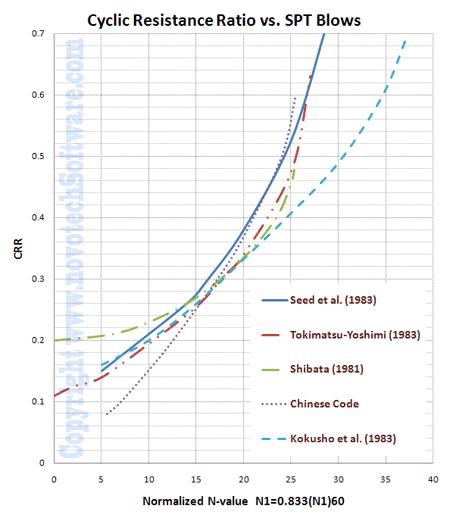
Other MethodsSome other CRR1 curves proposed by geoscientists are also implemented in NovoLIQ. These curves are shown in the following graph; Horizontal axis is normalized corrected SPT blow counts (N1=0.833N1(60)).
|


