Analysis Results
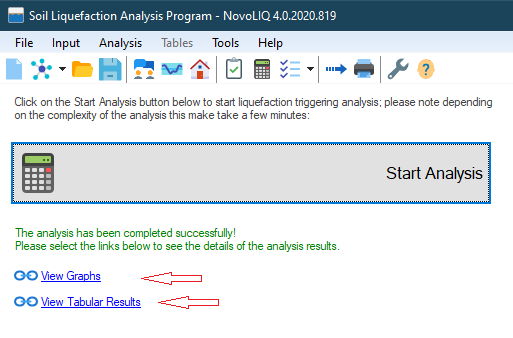
NovoLiq analysis results is shown when
Graphs include the following (click on each chart to open Chart Presentation Tool):
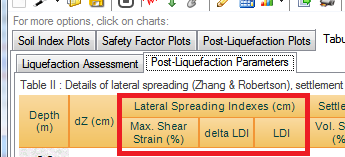
Note : For "Zhang & Robertson 2004" and "Faris 2006" methods, details of calculation will be provided at each depth in a tabular format. Three columns under "Lateral Spreading Indexes" present details of the method selected in Preferences page.
Calculation details include the following data:
Rd: depth reduction factor Overburden Pressure: total and effective soil overburden stress. If surcharge effect is activated in analysis, these overburden stresses include ΔP due to footing loads. Fines Content: the percentage of silt and clay at this depth (source: soil layers table) N60: SPT blow counts (N) corrected for sampler, rod length, borehole diameter, energy Co: correction factor = Cr.Cb.Cs.Ce for SPT Cn: correction factor; includes depth and water level correction for SPT N1(60)cs: equivalent clean sand, depth corrected, fines content corrected SPT blow counts
Click on SPT Correction Details link at the bottom-right corner of page to see the detailed calculations for correction factors at each depth.
|

