Reporting
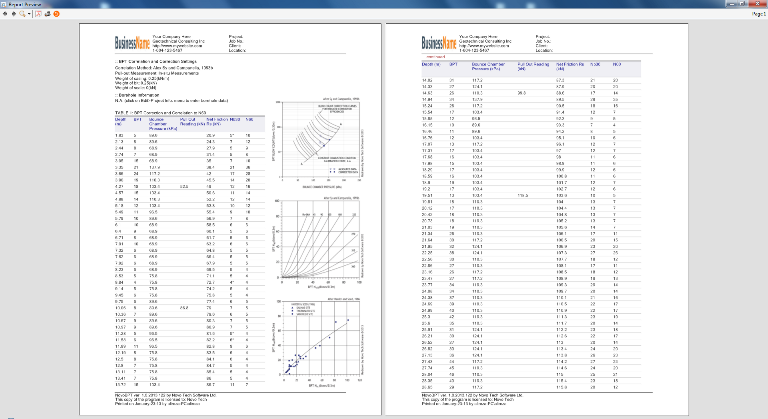
After performing the calculations if a report is needed, you can use of the following two options:
Please note that company information will be shown on the reports and can be edited from Edit→Company Info. menu.
On report preview page, you can directly print the report or save it as PDF file. |
