Correction & Correlation Charts
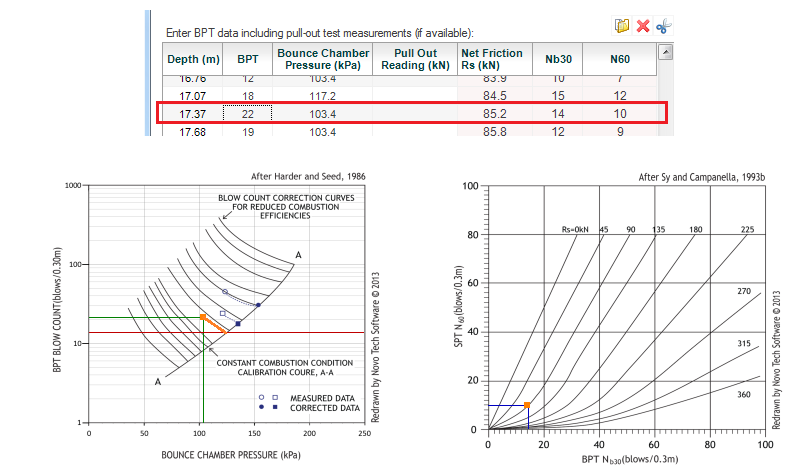
As user enters BPT data or clicks on a row of the table, data is shown on the pressure correction and N60 correlation charts. The following illustrates the charts:

At a depth of 17.37 m, BPT=22 and bounce chamber pressure P = 103.4 kPa. This point (BPT,P) is shown on the left chart by an orange square and two green lines. An orange line parallel to the closest contour shows the intersection with line A-A. The horizontal red line is drawn from this point to find the corrected BPT on vertical axis.
This corrected BPT is then used along with the net friction on the right chart to correlate BPT to N60.